Low Level Debug of STM32MP15c7
Published at June 21, 2021 · Last Modified at December 23, 2021 · 4 min read · Tags: linux u-boot stm32
Low Level Debug of STM32MP15c7
Published at June 21, 2021 · Last Modified at December 23, 2021 · 4 min read · Tags: linux u-boot stm32
Low-level debug of MCU may essential during the bring-up process of a new board. Especially for checking critical components like the DDR. The MCU under debubung is STM32MP157. I strongly based on the yocto build system for the SDK and the compilation and signature of the system. See here and How to configure TF for a manual build of TF-A without yocto. It can be uses the STM32_Programmer_CLI load TSV files into the EMMC.
~/stm32/STM32Cube/STM32CubeProgrammer/bin/STM32_Programmer_CLI -c port=usb1 -w ./FlashLayout_sdcard_stm32mp157c-dk2-trusted.tsv
The Trusted firmware for arm Cortex-A is essential for the secure boot process. It is loaded by internal code, which checks the validation of bl2 image. Usually, in production mode, the debug port is blocked, or JTAG does not exist at all, and therefore, debugging is not possible. I’m using the yocto system to build the project files.
This simple workaround works, but it changes the original BL2 images to influence debugging conditions on the product images. It is by just adding a simple infinite loop before the entry point. After the debugger is attached to the process, it has to break on the infinite and then manually jump to the following order—the endless loop.
/*---------------------------------------------
 * Jump to the main function.
 *---------------------------------------------*/
   b 	.
   bl	bl2_main
recompile TF-A using these commands:
/path/to/yocto/layers/meta-st/scripts/envsetup.sh
bitbake -fc compile tf-a-stm32mp
On STM32MP, every FSBL application should sign and have a special header; therefore, tf-a should be resigned to boot with the modified version. The yocto scrips also do it. Here the STM32 keyword at the beginning of the signed header.
hexdump -C -n4 arm-trusted-firmware/tf-a-stm32mp157f-dk2-trusted.stm32
00000000  53 54 4d 32                                       |STM2|
p *0x5c005014=0x47f
to read regisger value when MMU is activated use the following:
(gdb) monitor  mdw   phys 0x5c005014
0x5c005014: 0000047f
Enable Yocto SDK:
source /opt/st/stm32mp1/3.1-snapshot/environment-setup-cortexa7t2hf-neon-vfpv4-ostl-linux-gnueabi
In another terinal connect to OpenOCD:
source /opt/st/stm32mp1/3.1-snapshot/environment-setup-cortexa7t2hf-neon-vfpv4-ostl-linux-gnueabi
${OECORE_NATIVE_SYSROOT}/usr/bin/openocd -s ${OECORE_NATIVE_SYSROOT}/usr/share/openocd/scripts -f board/stm32mp15x_dk2.cfg
change directory to build directory nd active gdb:
source /opt/st/stm32mp1/3.1-snapshot/environment-setup-cortexa7t2hf-neon-vfpv4-ostl-linux-gnueabi
cd /path/to/yocto/build-openstlinuxweston-stm32mp1/tmp-glibc/work/stm32mp1-ostl-linux-gnueabi/tf-a-stm32mp/2.2.r2-r0/build/trusted
cgdb -d arm-ostl-linux-gnueabi-gdb  ./bl2/bl2.elf
And then type at the gdb:
target remote 127.0.0.1:3333
monitor reset halt
c
# typs ctl-c to break at the loop at a set breakpoint
hb bl2_main
#  debug port enabling
p *0x5c005014=0x47f
jump bl2_main
The port number 3333 is coming from this log message of OpenOCD :
Info : starting gdb server for stm32mp15x.cpu0 on 3333 ->The control port of cpu0
Info : Listening on port 3333 for gdb connections
Info : starting gdb server for stm32mp15x.cm4 on 3334
Info : Listening on port 3334 for gdb connections
ST solution is to use stm32wrapper4dbg tool. The loop above for 2 seconds and wait for two seconds to allow the debugger to halt the processor. It automatically enables the debug port and jumps to the original entry point of BL2. It is the right solution for low-level debugging of the STM32MP157. Refer for Wrapper for FSBL imagaes and how to debug TF-A for more details.
One simple use case for this debug purpose is to test the DDR set up at the bring-up stage. For example, the following two figures show the GDB reactions before and after the initialization of the DDR. It is located at the end of the BL2 before moving to the next stage.
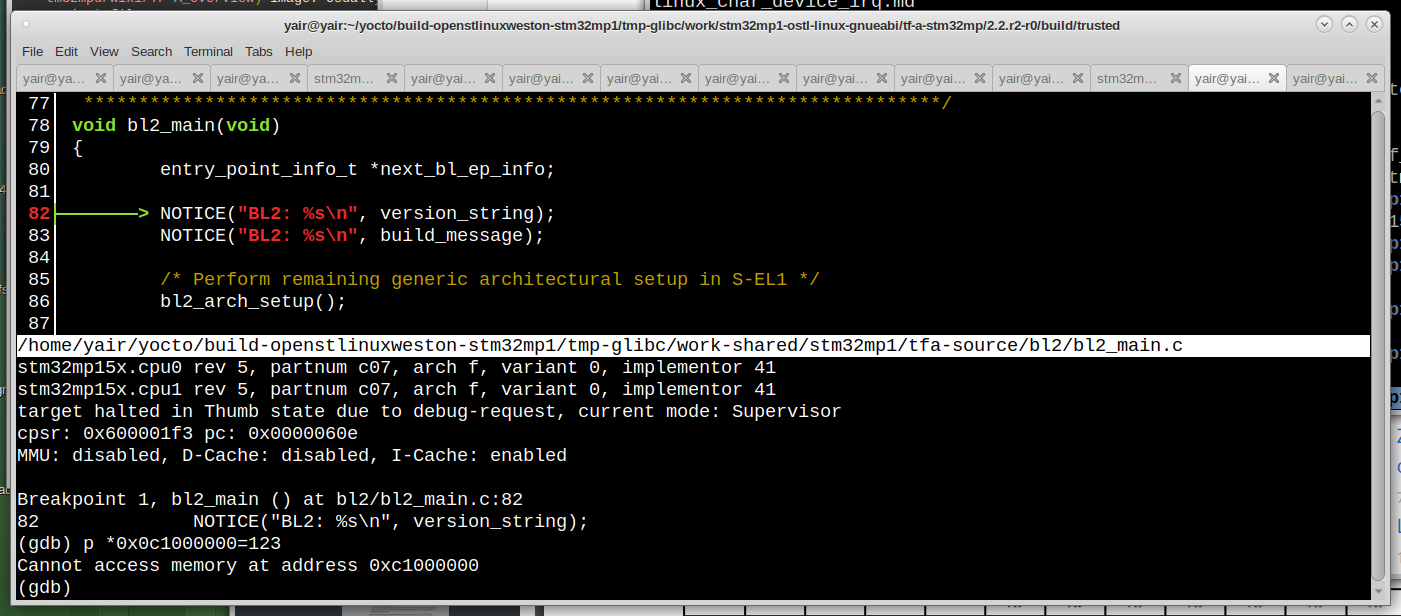
DDR Reading before init
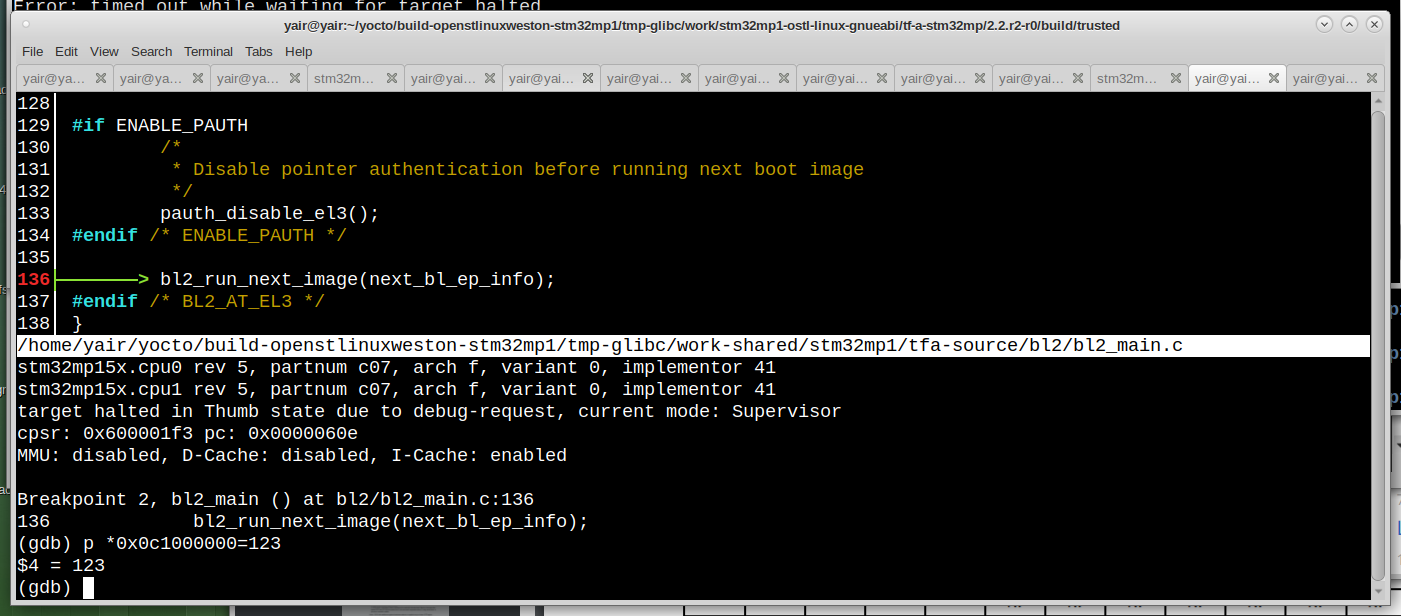
DDR Reading after init
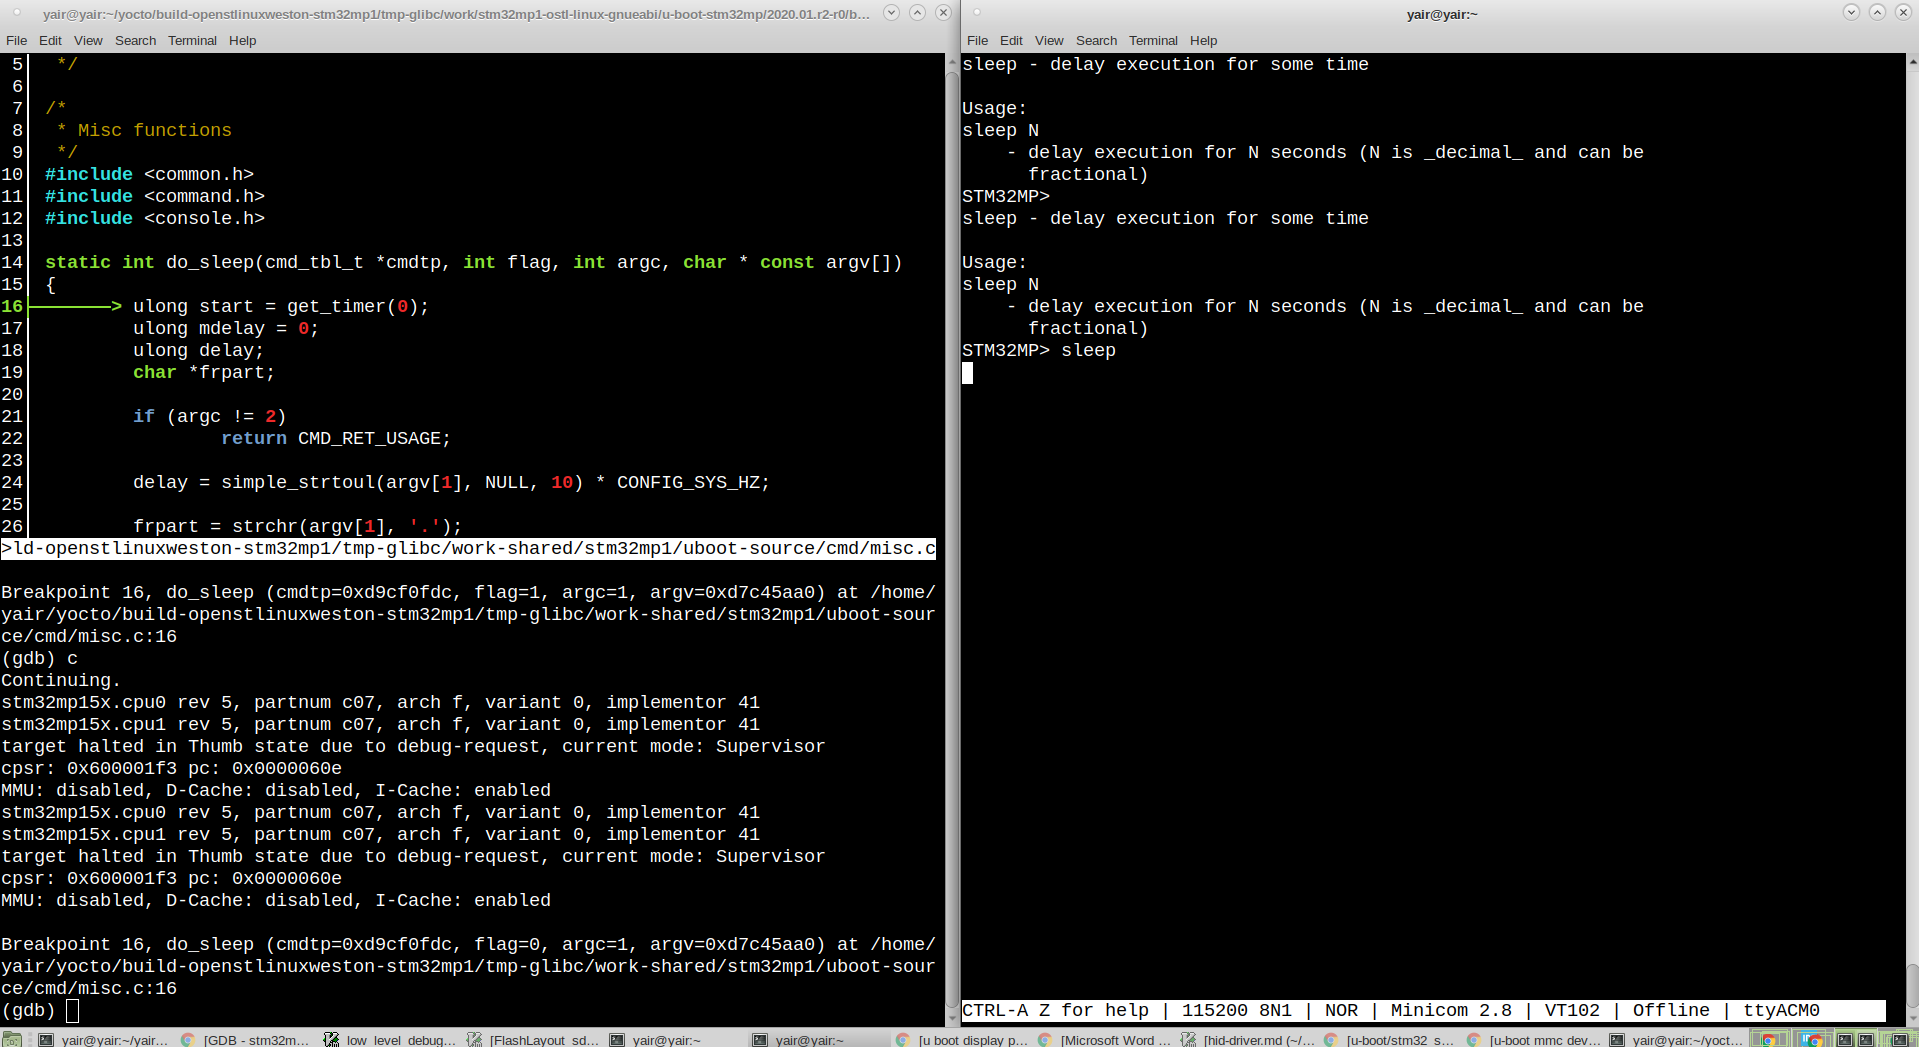
The second stage boot loader SSBL is the u-boot. I will use the yocto system to build and operate the u-boot, but here refference for a manual building of u-boot. Also, refer to DebuggingUBoot for more information regarding u-boot debugging.
hbreak *0xC0100000
commands
 symbol-file u-boot
 thbreak relocate_code
 commands
   print "RELOCATE U-Boot..."
   set $offset = ((gd_t *)$r9)->relocaddr
   print $offset
   symbol-file
   add-symbol-file u-boot $offset
   thbreak boot_jump_linux
   continue
   end
 continue
end
The gdb commands like hbreak, thbreak, break is set a breakpoint at somewhere in the code, the commands keyword followed by a set of commands to run after the breakpoint. For example, the u-boot binary has two parts. The first part loads the second part to another place in the RAM (Usually at the end of the RAM). The second part is the u-boot software binary linked to run in its new location at the RAM. The above GDB script places a breakpoint right after the first part is stated, reads the second part, loads debugging sysmbol file and sets a breakpoint in it.
DDR Reading after init
[1] How_to_debug_TF-A_BL2
[2] header_for_binary
[3] STM32MP15_Discovery_kits
[4] building-a-linux-system-for-the-stm32mp1
[5] debugging-u-boot-after-relocation
[6] debugging in uboot